o11y-weekly
Deep Dive Demo
Disclaimer
⚠️This demo is not a grafana labs production ready demo and used as local dev hands on and demo only.
Security, scalling and so on will not be introduced and GrafanaCloud offers the best experience and a no brainer solution to start with.
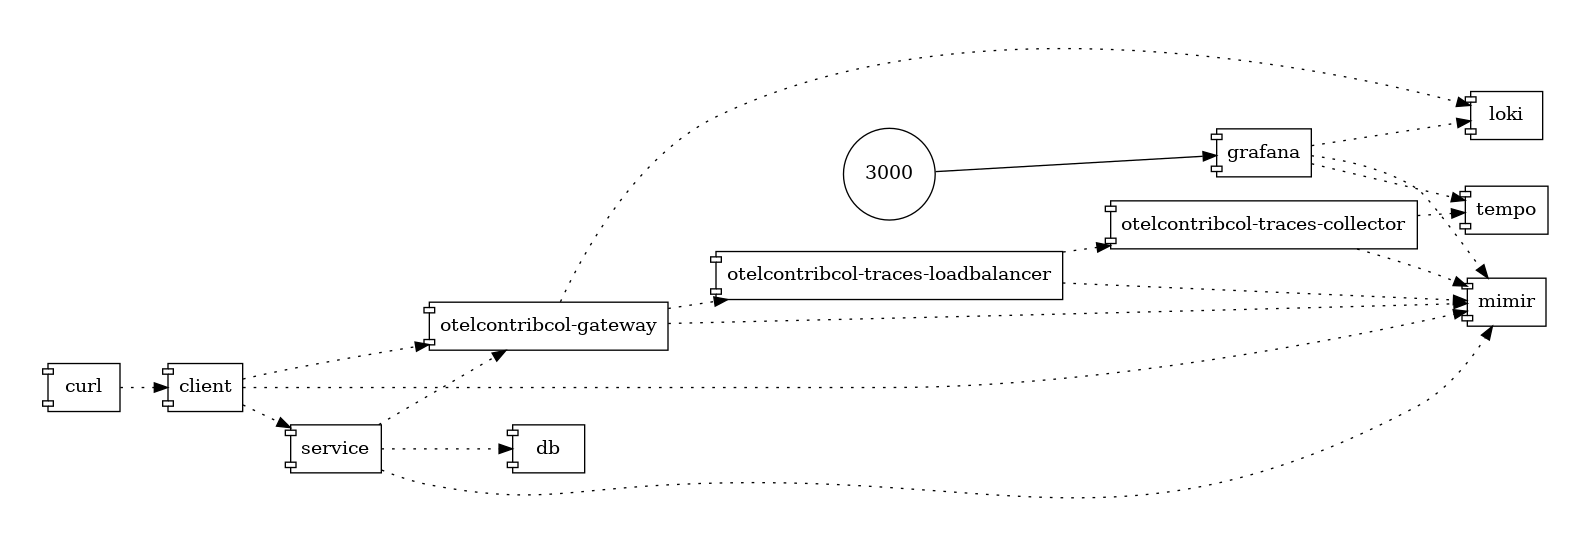
Architecture
This demo includes 2 java services (service and client) and a postgres database to use webserver and jdbc instrumentations.
OpenTelemetry Collector Contrib has been used as a Gateway and Agent
Run locally
Run the docker compose
git clone git@github.com:o11y-weekly/o11y-weekly.github.io.git
cd o11y-weekly.github.io/2024-01-31_OpenTelemetry_Looks_Good_To_Me/demo/
./up.sh
Run Grafana
Open Grafana: http://localhost:3000
2 folders:
- App: contains app dashboards
- OpenTelemetry Collector Contrib: Agent and Gateway monitoring
Grafana Dashboards
Java
1 Java dashboards are available:
OpenTelemetry Collector Monitoring
Deep Dive
Java Instrumentation setup
Automatic instrumentation
Reference : Automatic instrumentation
Manual instrumentation
Reference : Manual instrumentation
Setup Metrics instrumentation and exporter
Micrometer combined with the otlp registry has been used to push metrics with OTLP to mimir:
Client pom micrometer otlp dependency
<dependency>
    <groupId>io.micrometer</groupId>
    <artifactId>micrometer-registry-otlp</artifactId>
</dependency>
management:
  otlp:
    metrics:
      export:
        enabled: true
        step: 10s
        url: http://mimir:9009/otlp/v1/metrics
        # url: https://prometheus-prod-24-prod-eu-west-2.grafana.net/otlp/v1/metrics
        # headers:
        #   Authorization: Basic ####

  metrics:
    tags:
      deployment.environment: '${deployment.environment}'
      host.name: '${host.name}'
      service:
        name: '${service.name}'
        namespace: '${service.namespace}'
        version: '@project.version@'
    distribution:
      slo:
        http: 5, 10, 25, 50, 75, 100, 250, 500, 750, 1000, 2500, 5000, 7500, 10000
        jvm: 5, 10, 25, 50, 75, 100, 250, 500, 750, 1000, 2500, 5000, 7500, 10000
Logs
2 different methods has been used to send logs to LOKI.
Scrapping the file is a conventional and standard method to seng logs with a agent and used in the service application while [pushing logs to a gateway] is quite new and used in the client application.
File Log
In the service application, Logback has been used to write the logs into a file log.
<?xml version="1.0" encoding="UTF-8"?>
<configuration>
    <property resource="application.yml" />

    <appender name="FILE" class="ch.qos.logback.core.FileAppender">
        <file>log/${SERVICE_NAME}.log</file>
        <append>true</append>
        <encoder>
            <pattern>timestamp=%d{yyyy-MM-dd'T'HH:mm:ss.SSSXXX}\tservice.version=${service.version}\ttraceId=%X{trace_id}\tspanId=%X{span_id}\tmessage=%msg%n</pattern>
        </encoder>
    </appender>

    <root level="INFO">
        <appender-ref ref="FILE" />
    </root>
</configuration>
OpenTelemetry Collector contrib reads the file and forward logs to LOKI using the LOKI api.
Java Agent exporter
In the client application the Java agent sends log with OpenTelemetry embedded exporters.
Java agent command line (app command line) :
[program:app]
command=java
    -javaagent:/app/opentelemetry-javaagent.jar
    -Dservice.name=%(ENV_SERVICE_NAME)s
    -Dservice.namespace=%(ENV_SERVICE_NAMESPACE)s
    -Dhost.name=%(host_node_name)s
    -Ddeployment.environment=%(ENV_DEPLOYMENT_ENVIRONMENT)s
    -Dotel.resource.attributes=service.name=%(ENV_SERVICE_NAME)s,service.namespace=%(ENV_SERVICE_NAMESPACE)s,deployment.environment=%(ENV_DEPLOYMENT_ENVIRONMENT)s,host.name=%(host_node_name)s
    -jar /app/main.jar
    --spring.application.name=%(ENV_SERVICE_NAME)s
Traces
WithSpan attribute
Java Agent
OpenTelemetry Collector
Agent
Gateway
Traces Tail Sampling
Traces Tail sampling configuration:
processors:
  tail_sampling/latency-error:
    decision_wait: 10s
    policies:
      [
        # skip traces where latencies are < 100ms
        {
          name: latency-policy,
          type: latency,
          latency: {threshold_ms: 100}
        },
        # keep only error traces by skipping 4XX errors
        {
          name: error-policy,
          type: and,
          and:
            {
              and_sub_policy:
                [
                  {
                    name: status_code-error-policy,
                    type: status_code,
                    status_code: {status_codes: [ERROR]}
                  },
                  # exclude false positive like bad requests or not found
                  {
                    name: http-status-code-error-policy,
                    type: string_attribute,
                    string_attribute:
                      {
                        key: error.type,
                        values: [4..],
                        enabled_regex_matching: true,
                        invert_match: true,
                      },
                  },
                ]
            }
        }
      ]
OpenTelemetry Collector Contrib setup
Metrics
- Instrumentation: micrometer with otlp registry
- Collector: No Collector
Logs
Agent mode
Inside the service container, supervisord is used to run the agent like a kubernetes sidecar.
- Instrumentation: manual with logback and a file log
- Collector: OpenTelemetry Collector Contrib Agent which scrape the log file and send logs to loki.
OpenTelemetry Collector Agent configuration
receivers:
  filelog/app:
    include: [ /app/log/*.log ]
    storage: file_storage/app
    multiline:
      line_start_pattern: timestamp=
    operators:
      - type: key_value_parser
        delimiter: "="
        pair_delimiter: "\t"
      - type: move
        from: attributes["service.version"]
        to: resource["service.version"]
      - type: move
        from: attributes.message
        to: body
      - type: time_parser
        parse_from: attributes.timestamp
        layout_type: strptime
        layout: "%Y-%m-%dT%H:%M:%S.%LZ" #2024-04-11T12:39:13.402Z
      - type: remove
        field: attributes.timestamp
      - type: trace_parser
        trace_id:
          parse_from: attributes.traceId
        span_id:
          parse_from: attributes.spanId
      - type: remove
        field: attributes.traceId
      - type: remove
        field: attributes.spanId
    resource:
      service.name: ${env:SERVICE_NAME}
      service.namespace: ${env:SERVICE_NAMESPACE}
      host.name: ${env:HOSTNAME}
      deployment.environment: ${env:DEPLOYMENT_ENVIRONMENT}

processors:
  batch/app:

service:
  pipelines:
    logs/app:
      receivers: [filelog/app]
      processors: [batch/app]
      exporters: [otlphttp/gateway/loki, debug]
No Collector mode
Inside the client app.
- Instrumentation: OpenTelemetry Java Agent
- Collector: OpenTelemetry Collector Contrib Gateway which sends otlp logs to loki
Gateway configuration to collect logs.
processors:
  batch/loki:
service:
  pipelines:
    logs/gateway:
      receivers: [otlp/gateway]
      processors: [batch/loki]
      exporters: [otlphttp/gateway/loki]```

## OpenTelemetry Collector Contrib Monitoring

### HostMetrics (node exporter)

Push host metrics to mimir

[OpenTelemetry Collector HostMetrics configuration](/2024-01-31_OpenTelemetry_Looks_Good_To_Me/demo/otelcontribcol/gateway/pipeline.agent.yml)
```yaml
exporters:
  debug:
    verbosity: detailed
  otlphttp/gateway/mimir:
    endpoint: http://mimir:9009/otlp

receivers:
  # otelcontribcol metrics + host metrics
  prometheus/gateway:
    config:
      scrape_configs:
        - job_name: otelcol-contrib/gateway
          scrape_interval: 10s
          static_configs:
            - targets: [0.0.0.0:8888]
  hostmetrics/gateway:
    collection_interval: 10s
    scrapers:
      cpu:
        metrics:
          system.cpu.logical.count:
            enabled: true
      memory:
        metrics:
          system.memory.utilization:
            enabled: true
          system.memory.limit:
            enabled: true
      load:
      disk:
      filesystem:
        metrics:
          system.filesystem.utilization:
            enabled: true
      network:
      paging:
      processes:
      process:
        mute_process_user_error: true
        metrics:
          process.cpu.utilization:
            enabled: true
          process.memory.utilization:
            enabled: true
          process.threads:
            enabled: true
          process.paging.faults:
            enabled: true

processors:
  batch/gateway:
  attributes/gateway:
    actions:
      - key: service.namespace
        action: upsert
        value: gateway
      - key: service.name
        action: upsert
        value: otelcol-contrib/gateway
  resourcedetection/system:
    detectors: ["system"]
    system:
      hostname_sources: ["os"]
  transform:
    metric_statements:
      - context: datapoint
        statements:
          - set(attributes["host.name"], resource.attributes["host.name"])
          - set(attributes["process.command"], resource.attributes["process.command"])
          - set(attributes["process.command_line"], resource.attributes["process.command_line"])
          - set(attributes["process.executable.name"], resource.attributes["process.executable.name"])
          - set(attributes["process.executable.path"], resource.attributes["process.executable.path"])
          - set(attributes["process.owner"], resource.attributes["process.owner"])
          - set(attributes["process.parent_pid"], resource.attributes["process.parent_pid"])
          - set(attributes["process.pid"], resource.attributes["process.pid"])


service:
  telemetry:
    metrics:
      level: detailed
    logs:
      level: info

  pipelines:
    metrics/gateway:
      receivers: [prometheus/gateway, hostmetrics/gateway]
      processors: [attributes/gateway, resourcedetection/system, transform, batch/gateway]
      exporters: [otlphttp/gateway/mimir]
Pipeline
Detailed metrics are providen from OpenTelemetry Collector which should be activated:
Telemetry service for OpenTelemetry Collector
service:
  telemetry:
    metrics:
      level: detailed
    logs:
      level: info