o11y-weekly
2024-02-28 #10 OpenTelemetry Looks Good To Me for dotnet
This post has been adapted for dotnet from the previous java post. A new dashboard is available for specific dotnet instrumentation: OpenTelemetry dotnet webapi.
OpenTelemetry Collector Contrib configuration is the same as java since, both java and dotnet are using the same OTLP specification. This is a good things for SRE supporting multiple stacks and languages since the gateway configuration is common.
Disclaimer
⚠️This demo is not a grafana labs production ready demo and used as local dev hands on and demo only.
Security, scalling and so on will not be introduced and GrafanaCloud offers the best experience and a no brainer solution to start with.
Architecture
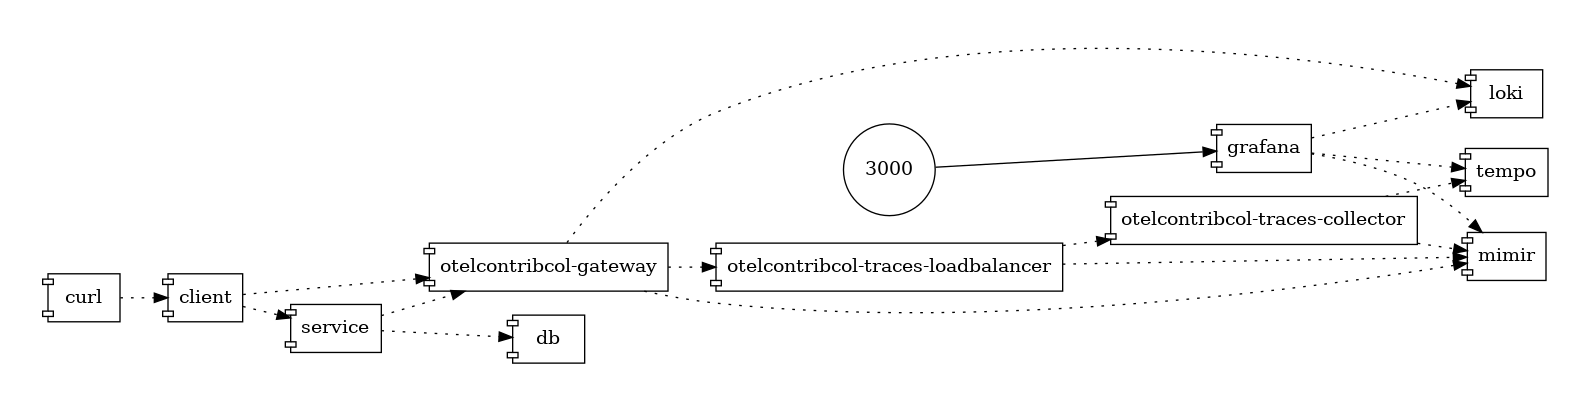
This demo includes 2 dotnet webapi applications (service and client) and a postgres database to use webserver and custom dotnet instrumentations.
OpenTelemetry Collector Contrib has been used as a Gateway
Run locally
Run the docker compose
git clone git@github.com:o11y-weekly/o11y-weekly.github.io.git
cd o11y-weekly.github.io/2024-02-28_OpenTelemetry_Looks_Good_To_Me_dotnet/
./up.sh
Run Grafana
Open Grafana: http://localhost:3000
2 folders:
- App: contains app dashboards
- OpenTelemetry Collector Contrib: Gateway monitoring
Grafana Dashboards
dotnet
An OpenTelemetry dotnet webapi dashboard has been created during this post and availble at grafana dashboards:
OpenTelemetry Collector Monitoring
Deep Dive
Dotnet Instrumentation setup
References:
Automatic instrumentation
Reference : Automatic instrumentation
Manual instrumentation
Reference : Manual instrumentation
dotnet add package OpenTelemetry.Exporter.OpenTelemetryProtocol
dotnet add package OpenTelemetry.Instrumentation.AspNetCore
dotnet add package OpenTelemetry.Instrumentation.Http
dotnet add package OpenTelemetry.Instrumentation.Runtime
dotnet add package System.Diagnostics.DiagnosticSource
dotnet add package OpenTelemetry.Instrumentation.Process --version 0.5.0-beta.4
Setup Metrics instrumentation and exporter
References:
⚠️Note that the process instrumentation is still in beta.
dotnet add package OpenTelemetry.Exporter.OpenTelemetryProtocol
dotnet add package OpenTelemetry.Instrumentation.AspNetCore
dotnet add package OpenTelemetry.Instrumentation.Http
dotnet add package OpenTelemetry.Instrumentation.Runtime
dotnet add package System.Diagnostics.DiagnosticSource
dotnet add package OpenTelemetry.Instrumentation.Process --version 0.5.0-beta.4
builder
.Services
    .AddOpenTelemetry()
    .ConfigureResource(resource => resource.AddService(
            serviceName: SERVICE_NAME,
            serviceVersion: System.Reflection.Assembly.GetEntryAssembly()?.GetName().Version?.ToString(3) // SemVer
            )
        .AddAttributes(new Dictionary<string, object>
            {
                { "host.name", Environment.MachineName }
            })
        )
    .WithMetrics(opts => opts
        .AddAspNetCoreInstrumentation()
        .AddRuntimeInstrumentation()
        .AddHttpClientInstrumentation()
        .AddProcessInstrumentation()
        .AddOtlpExporter()
    );
Logs
No file logger has been used in this setup but it is also possible to use otelcontrib-col as log scrapper to forward file log contents to telemetry backend.
The OTLP log exporter has been used during this setup.
builder
.Logging.AddOpenTelemetry(logging =>
    {
        logging.IncludeFormattedMessage = true;
        logging.AddOtlpExporter();
    }
)
Traces
builder
.Services
    .AddOpenTelemetry()
    .ConfigureResource(resource => resource.AddService(
            serviceName: SERVICE_NAME,
            serviceVersion: System.Reflection.Assembly.GetEntryAssembly()?.GetName().Version?.ToString(3) // SemVer
            )
        .AddAttributes(new Dictionary<string, object>
            {
                { "host.name", Environment.MachineName }
            })
        )
    .WithTracing(tracing => tracing
        .AddAspNetCoreInstrumentation()
        .AddHttpClientInstrumentation()
        .AddNpgsql()
        .AddSource(SERVICE_NAME)
        .AddOtlpExporter()
    );
Custom traces
References:
builder
.Services
    .AddOpenTelemetry()
    .ConfigureResource(resource => resource.AddService(
            serviceName: SERVICE_NAME,
            serviceVersion: System.Reflection.Assembly.GetEntryAssembly()?.GetName().Version?.ToString(3) // SemVer
            )
        .AddAttributes(new Dictionary<string, object>
            {
                { "host.name", Environment.MachineName }
            })
        )
    .WithTracing(tracing => tracing
        .AddAspNetCoreInstrumentation()
        .AddHttpClientInstrumentation()
        .AddNpgsql()
        .AddSource("test") // register activity source "test"
        .AddOtlpExporter()
    );

var REGISTERED_ACTIVITY = new ActivitySource("test"); // declare activity "test"
var callSlowDependency = async (int counter, int delay) =>
{
    //start an activity "test" for "callSlowDependency"
    using var activity = REGISTERED_ACTIVITY.StartActivity("callSlowDependency");
    if (isEnabled(counter, LATENCY_RATIO))
    {
        activity?.SetTag("delay", delay);
        await Task.Delay(delay);
    }
};
OpenTelemetry Collector
Gateway
Traces Tail Sampling
Traces Tail sampling configuration:
processors:
  tail_sampling/latency-error:
    decision_wait: 10s
    policies:
      [
        # skip traces where latencies are < 100ms
        {
          name: latency-policy,
          type: latency,
          latency: {threshold_ms: 100}
        },
        # keep only error traces by skipping 4XX errors
        {
          name: error-policy,
          type: and,
          and:
            {
              and_sub_policy:
                [
                  {
                    name: status_code-error-policy,
                    type: status_code,
                    status_code: {status_codes: [ERROR]}
                  },
                  # exclude false positive like bad requests or not found
                  {
                    name: http-status-code-error-policy,
                    type: string_attribute,
                    string_attribute:
                      {
                        key: error.type,
                        values: [4..],
                        enabled_regex_matching: true,
                        invert_match: true,
                      },
                  },
                ]
            }
        }
      ]
OpenTelemetry Collector Contrib Monitoring
HostMetrics (node exporter)
Push host metrics to mimir
OpenTelemetry Collector HostMetrics configuration
exporters:
  debug:
    verbosity: detailed
  otlphttp/gateway/mimir:
    endpoint: http://mimir:9009/otlp

receivers:
  # otelcontribcol metrics + host metrics
  prometheus/gateway:
    config:
      scrape_configs:
        - job_name: otelcol-contrib/gateway
          scrape_interval: 10s
          static_configs:
            - targets: [0.0.0.0:8888]
  hostmetrics/gateway:
    collection_interval: 10s
    scrapers:
      cpu:
        metrics:
          system.cpu.logical.count:
            enabled: true
      memory:
        metrics:
          system.memory.utilization:
            enabled: true
          system.memory.limit:
            enabled: true
      load:
      disk:
      filesystem:
        metrics:
          system.filesystem.utilization:
            enabled: true
      network:
      paging:
      processes:
      process:
        mute_process_user_error: true
        metrics:
          process.cpu.utilization:
            enabled: true
          process.memory.utilization:
            enabled: true
          process.threads:
            enabled: true
          process.paging.faults:
            enabled: true

processors:
  batch/gateway:
  attributes/gateway:
    actions:
      - key: service.namespace
        action: upsert
        value: gateway
      - key: service.name
        action: upsert
        value: otelcol-contrib/gateway
  resourcedetection/system:
    detectors: ["system"]
    system:
      hostname_sources: ["os"]
  transform:
    metric_statements:
      - context: datapoint
        statements:
          - set(attributes["host.name"], resource.attributes["host.name"])
          - set(attributes["process.command"], resource.attributes["process.command"])
          - set(attributes["process.command_line"], resource.attributes["process.command_line"])
          - set(attributes["process.executable.name"], resource.attributes["process.executable.name"])
          - set(attributes["process.executable.path"], resource.attributes["process.executable.path"])
          - set(attributes["process.owner"], resource.attributes["process.owner"])
          - set(attributes["process.parent_pid"], resource.attributes["process.parent_pid"])
          - set(attributes["process.pid"], resource.attributes["process.pid"])


service:
  telemetry:
    metrics:
      level: detailed
    logs:
      level: info

  pipelines:
    metrics/gateway:
      receivers: [prometheus/gateway, hostmetrics/gateway]
      processors: [attributes/gateway, resourcedetection/system, transform, batch/gateway]
      exporters: [otlphttp/gateway/mimir]
Pipeline
Detailed metrics are providen from OpenTelemetry Collector which should be activated:
Telemetry service for OpenTelemetry Collector
service:
  telemetry:
    metrics:
      level: detailed
    logs:
      level: info