o11y-weekly
2024-01-31 #9 OpenTelemetry Looks Good To Me
LGTM are a GrafanaLabs products initials and a joke for Loki, Grafana, Tempo and Mimir which have been used in this deep dive demo: show the deep dive demo code
OpenTelemetry becomes standard and really useful to solve common problems in observability but does not solve all the Observability problems. This is why Grafana Labs product and OpenTelemetry work all together to both send telemetry and visualize / use them thanks Grafana Labs.
A local docker compose demo with GrafanaLabs LGTM for java and OpenTelemetry is available
Introduction
Reference: https://o11y-weekly.github.io/2023-11-30_What_is_OpenTelemetry/ A previous post is available to explain what is OpenTelemetry while this post is focusing on how to use it and what is the outcome ?
Naming conventions / Semantic-conventions
References:
- https://opentelemetry.io/docs/concepts/semantic-conventions/
- https://grafana.com/docs/opentelemetry/instrumentation/configuration/resource-attributes/
Without naming and value conventions, correlating signals can become quickly a nightmare, to solve that issue, OpenTelemetry Semantic Conventions concept is really good to start and integrate.
In the following demo, resources have been defined to have such attributes for all signals to query and correlate telemetry for those dimensions.
| Resource Attribute | Value |
|---|---|
| service.name | the application name |
| service.namespace | namespace to group multiple service Bounded context |
| service.version | version of the service |
| host.name | hostname |
| deployment.environment | the environment where the application runs (dev,test,prod, …) |
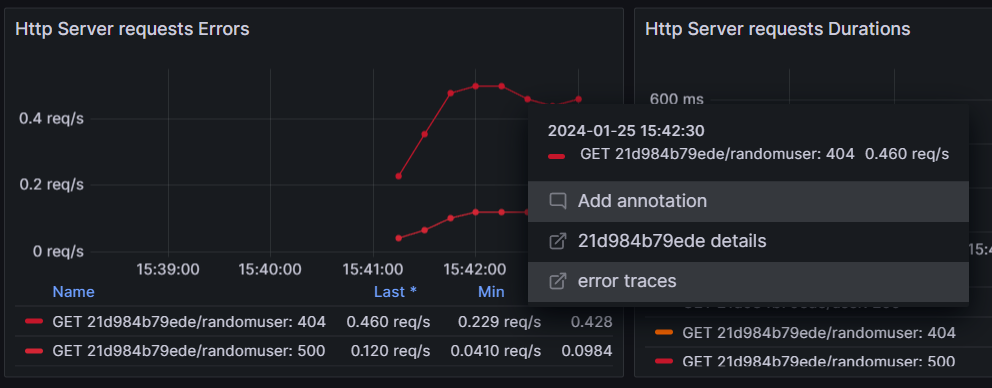
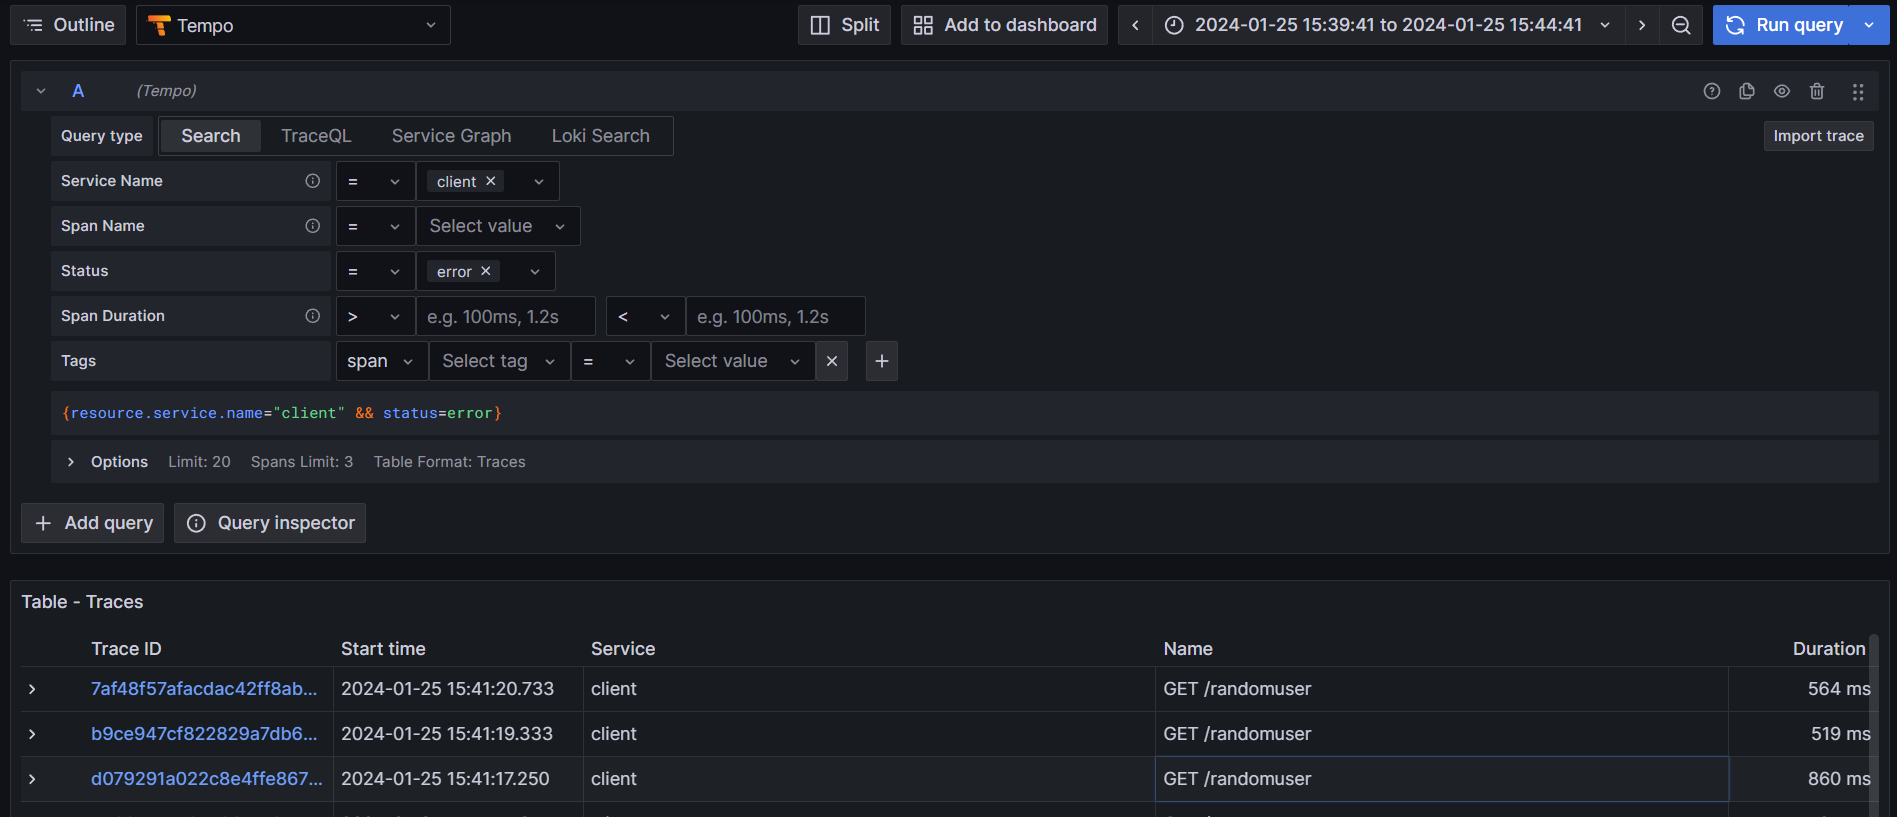
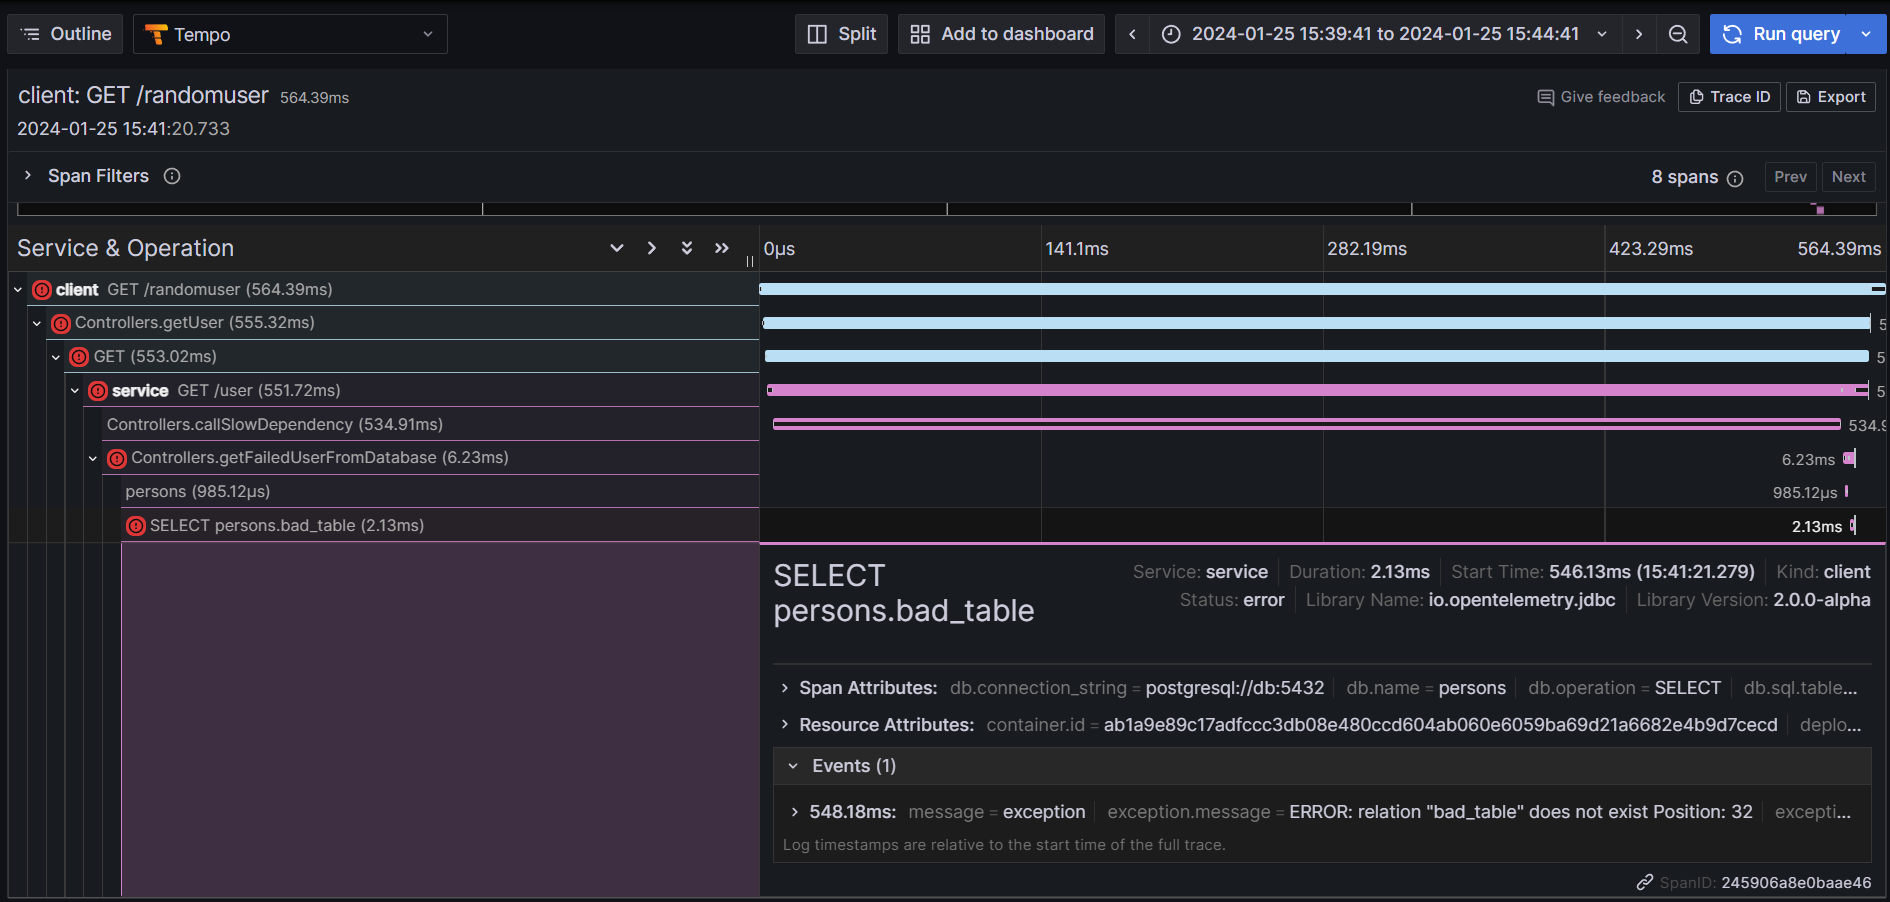
As an example, by clicking on errors, it can be easy to get corresponding traces:
RED/USE metrics
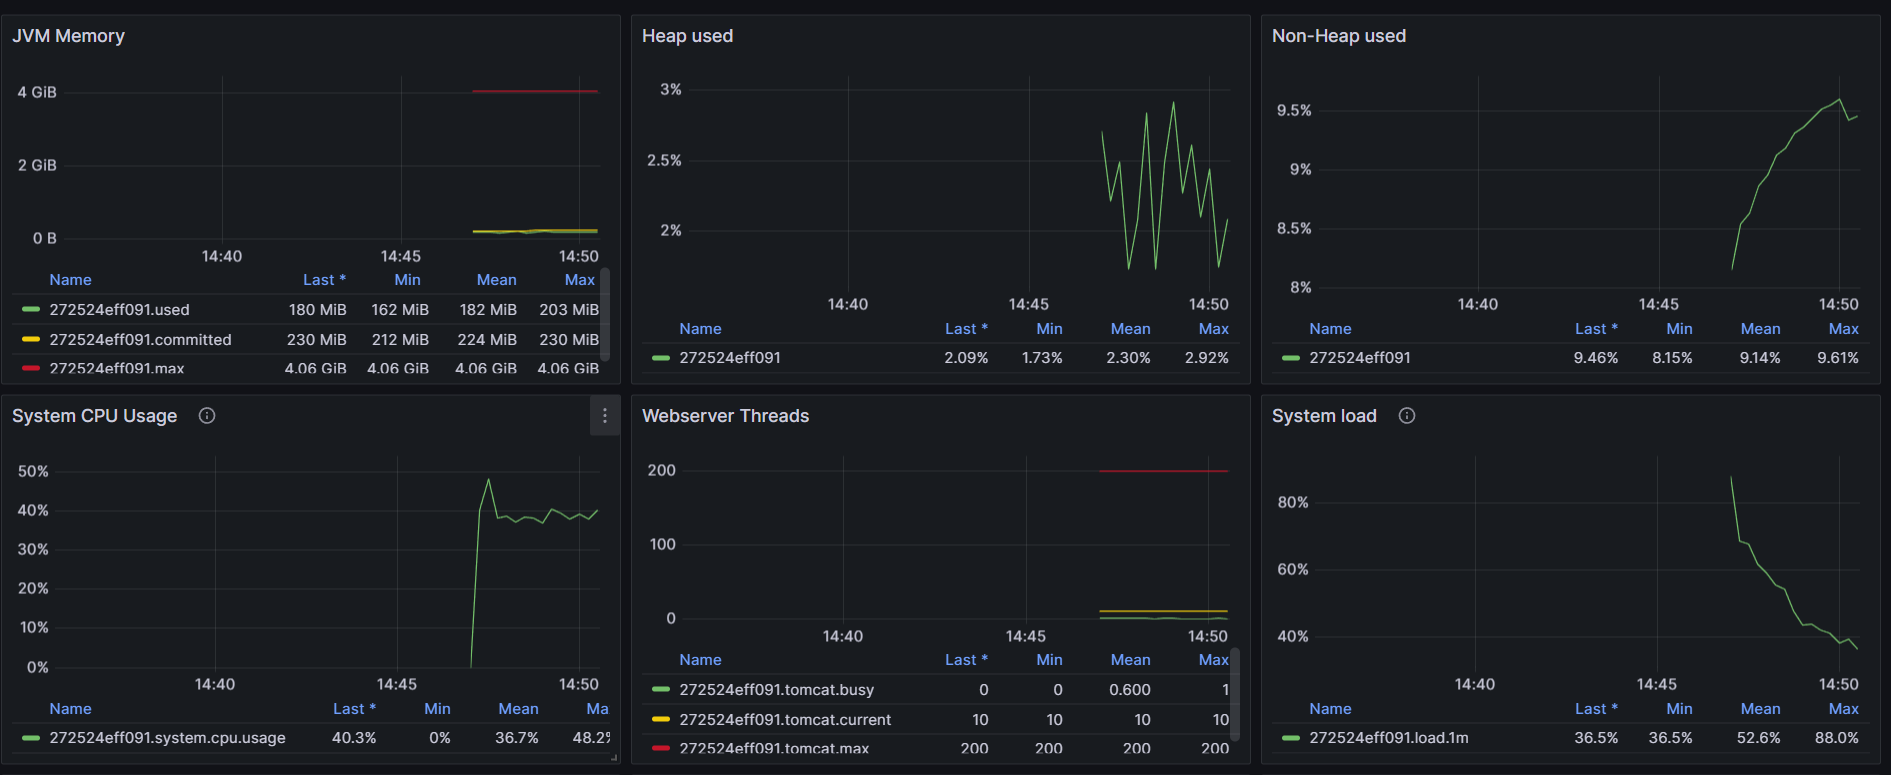
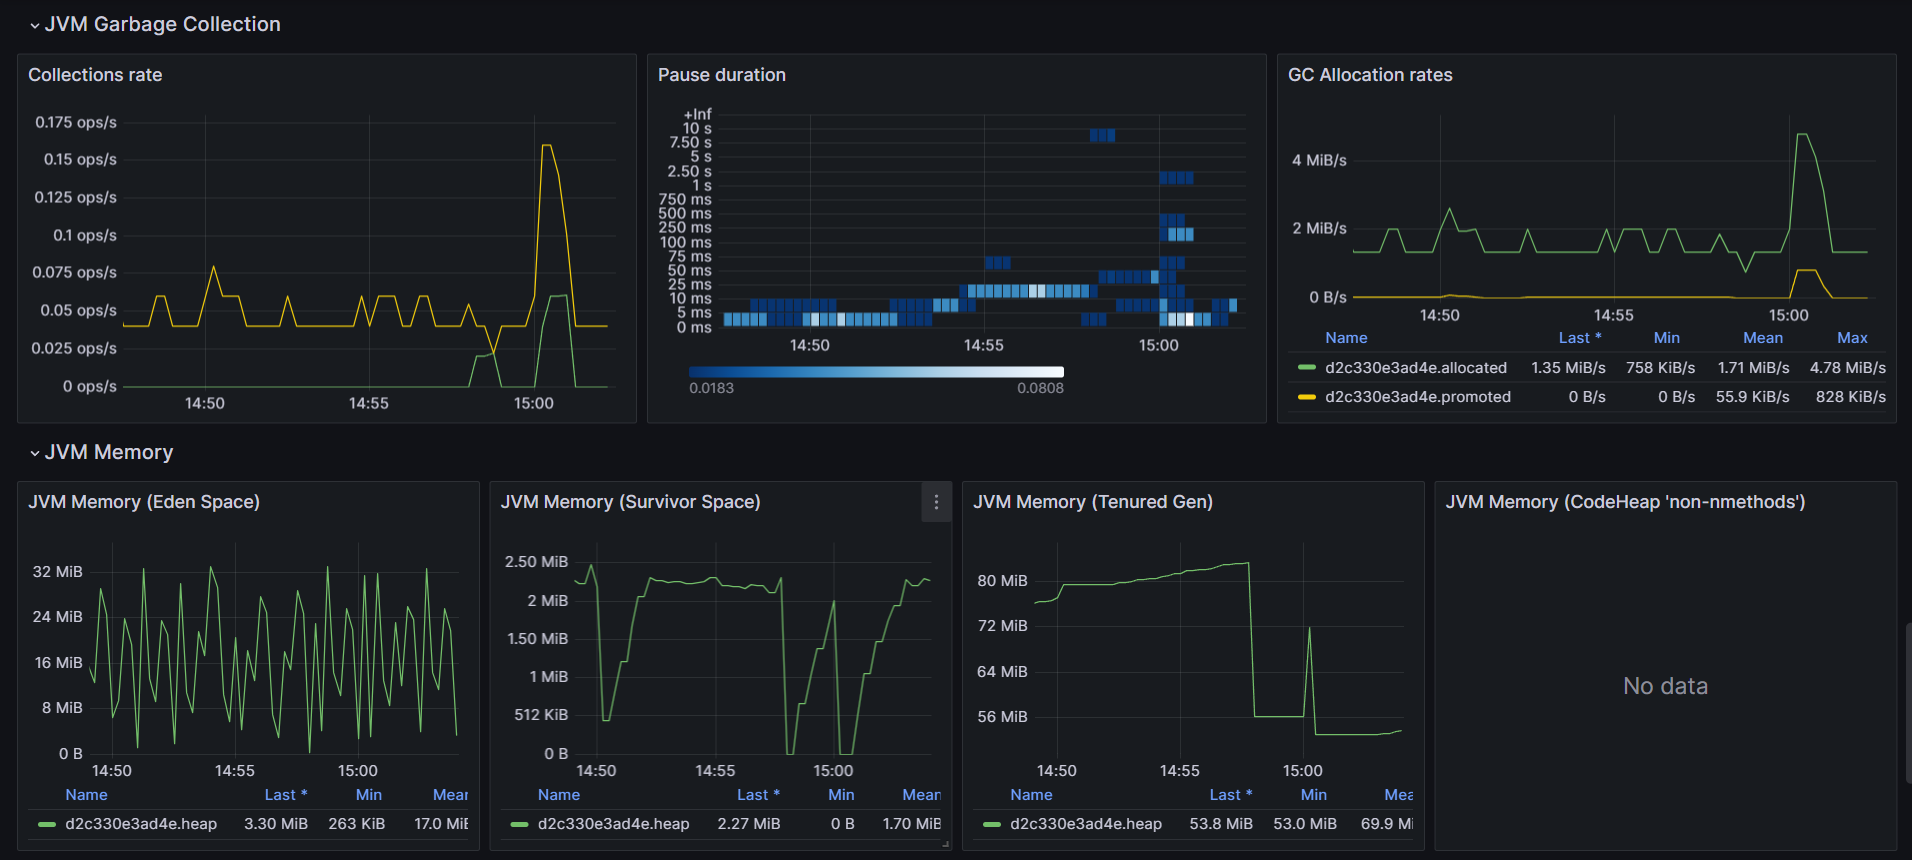
RED method has been used to track errors, rates and durations to quickly identify potential problems and correlations.
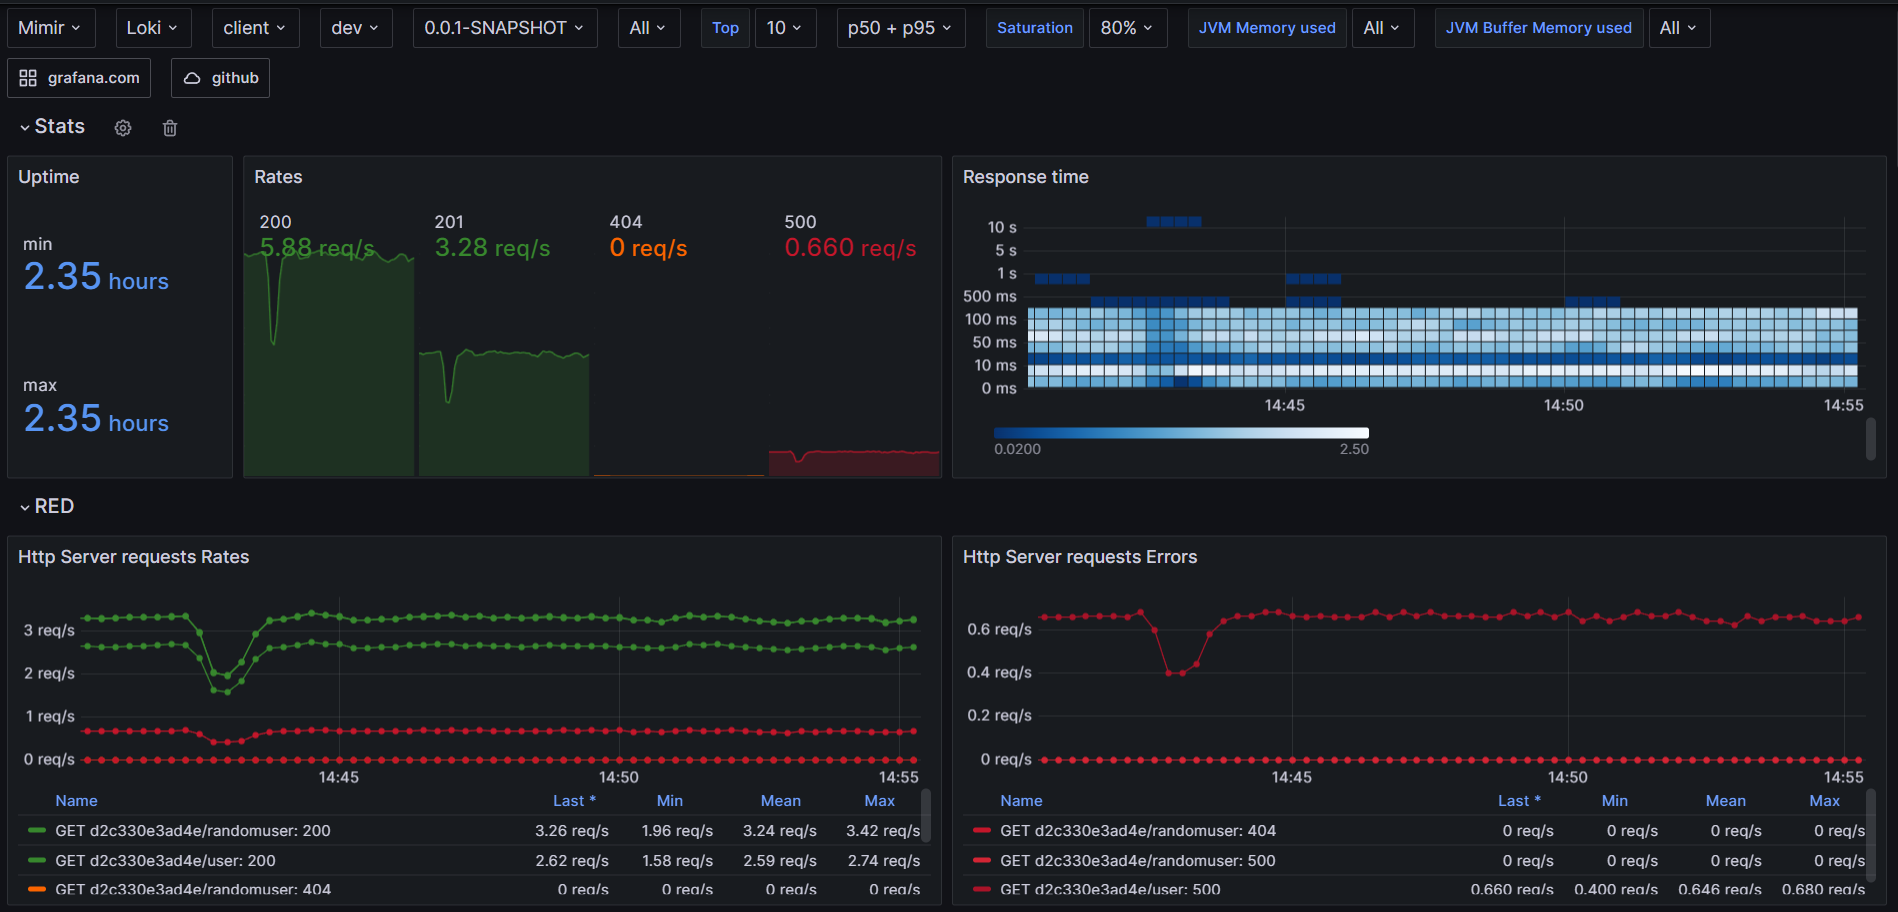
For the Java internals, USE method has been integrated to measure jvm utilization. In this example, there is no queues to monitor but heavy usage and the saturation part has been adjusted to display only series higher than 80% of utilization for the sake of the demo. About saturation, monitoring GC pause duration participate to the overhall response time and important to track.
Traces Sampling: Head vs Tail sampling
This demo uses tail sampling introduced during the last Tail sampling post.
By default, head sampling is used to decided the percentage of the traffic that should be traced. Parent based head sampling is commonly used to avoid truncated spans but can become inefficient to optimize p99 requests.
While starting with head sampling can be done easily with good results, tracking p99 optimization can be hard since it really depends of the ratio and the probability to get the full trace. When the ratio is close to 100%, it means that almost all the traces end to the traces backend and come at cost.
No sampling is just a waste of resource since only errors and latencies are important.
Tail sampling has been setup with opentelemetry collector contrib in this demo.
Again, when tracing error, it becomes important to avoid tracing 4XX errors when it is not useful or important.
Pay close attention that introducing a Gateway comes with trade-offs.
Temporary putting the sampling at 100% if it does not impact the bill or the observability backend is just ok.
Instrumentations
A dedicated post section has been introduced during the last post.
Having telemetry backends is not the only one requirement to support observability: instrumentations are really important to get telemetry metrics, logs and traces.
Having standard instrumentation really helps opensource projects to give a fully integrated service including observability and monitoring.
As opposed, having too much telemetry can be costly and it becomes important to choose carefully instrumented middleware when using automatic instrumentation
Collectors
References: https://opentelemetry.io/docs/collector/deployment/
OpenTelemetry offers different ways to integrate a collector. The official OpenTelemetry Collector can be forked or partially used to build a different one like the Grafana Agent or simply enhanced like OpenTelemetry Collector Contrib which has been used during the demo.
SDKs also offer exporters which are the No Collector mode.
3 different ways are available to deploy a collector: No Collector, Agent, Gateway.
All this deployments are used in the demo.
The Agent is quite common and used to scrap telemetry like prometheus, filelog, …
The No Collector can help to support observability in short lived tasks (like Function As A Service, …) while Gateway can help to introduce Tail Sampling and avoid loosing telemetry data when No Collector is used.
The agent monitoring is also important, the gateway has been instrumented and dashboard has also been provisionned in the demo
As mentioned before, it is all about trade-offs.
Trade-offs
| Pros | Cons | |
|---|---|---|
| No Collector | + Simple to use (especially in a dev/test environment) + No additional moving parts to operate (in production environments) |
- Requires code changes if collection, processing, or ingestion changes - Strong coupling between the application code and the backend - There are limited number of exporters per language implementation |
| Agent | + Simple to get started + Clear 1:1 mapping between application and collector |
- Scalability (human and load-wise) - Inflexible |
| Gateway | + Separation of concerns such as centrally managed credentials + Centralized policy management (for example, filtering certain logs or sampling) |
- It’s one more thing to maintain and that can fail (complexity) - Added latency in case of cascaded collectors - Higher overall resource usage (costs) |
Short lived task
While Agent mode is the most used to start, it becomes complex to use this mode with short lived task like Function as a service or scheduled task since the telemetry might not be exported after the graceful shutdown.
For this purpose, maintaining an Agent or a Gateway is quite the same and less complex.
This is why, in such cases, using OTLP really helps to avoid using an Agent but instead, pushing the telemetry to a backend (a Gateway) co-located with the short lived tasks.
Scaling Collectors
Reference: https://opentelemetry.io/docs/collector/scaling/
Monitoring collectors is really important to avoid out of control agent antipattern.
Without agent monitoring, it becomes complex to scale and understand the volumes and problems.
OpenTelemetry Collectors combined with Mimir is a good choice to monitor all agents and gateway to be sure that everything is working correctly or need scaling.
This dashboard from MonitoringArtist has been used and updated.
Telemetry Queries
Having well instrumented middlewares/libraries available without a proper/common way to query and build dashboard is annoying.
This is why Grafana Labs comes in to play and has been smart to integrate Mimir (Previously Cortex) compatible with Graphite and PromQL.
Grafana Labs push really hard to integrate PromQL like query models inside their products like Loki (LogQL) and Tempo (TraceQL).
Dashboard templates
What a nightmare to monitor same kind of application but with different ways and tools. At some point, when using micro services at scale, it becomes important to have the same approach for the same problems. Building dashboard templates increase the productivity and the Grafana Labs dashboard is a good place to share them.
Along the demo, 2 dashboards have been published to Grafana Labs dashboard:
- https://grafana.com/grafana/dashboards/20352-opentelemetry-jvm-micrometer/
- https://grafana.com/grafana/dashboards/20376-opentelemetry-collector-hostmetrics-node-exporter/
Those dashboard are provisionned in the demo.
One more dashboard has been used to monitor OpenTelemetry Collectors: https://grafana.com/grafana/dashboards/15983-opentelemetry-collector/
What if everything goes wrong ?
Error and latencies impact on observability platform
An old topic regarding the true cost of errors (logs and traces). Without a proper sampling management, observability backend can be hammered in case of errors and/or latencies.
Example: everything is failling and all the traces end in the backend.
Solution:
- Reduce the ratio but it can be annoying to redeploy everything during an outage.
- Use collector probabilistic tail sampling Gateway on outage if needed and monitor agents/gateway properly thanks to Grafana dashboards and Mimir.
Sidenotes
OTEL > LOKI labels mapping
References: https://github.com/grafana/loki/blob/main/docs/sources/send-data/otel/_index.md
OTLP support from loki is quite recent, during the demo, the service.version label is skipped according to this allow listed labels